How I analyse my personal finances
The Joy of Tracking
It is very rewarding to set a goal and make progressive steps to reaching it. There is a lot of joy to be had from setting a target and making one percent gains towards it on a daily basis. At times the progress can seem slow and insignificant, but persistence and discipline are very good virtues to have when pursuing a big goal. The pursuit of someday becoming financially independent is definitely no small feat and something that is worth working towards.
I enjoy tracking my finances as it gives me a sense how much progress I am making in my FI journey. I have tried many different software solutions, also tried tracking my expenses on Excel files and many years ago even documented it with pen and paper. There are pro’s and con’s to each method, but ultimately the selected method needs to match your specific needs. After a decade of trying many different methods, I use a combination of Google Sheets and Tableau to create my own personal finance dashboard.
How do you track your personal finances?
Pareto Principle
I have decided to focus on two areas of my finances, they are:
1) Monthly Expenses
2) FI Progress
Monthly Expenses

The first area of focus to track is the outflows. This includes all expenses that we effectively consume, so this would be items such as food, entertainment, living expenses such as mortgage and utilities, vacations, health insurance, restaurants, transportation and many more. Ultimately, this would exclude any savings, retirement contributions or investments.
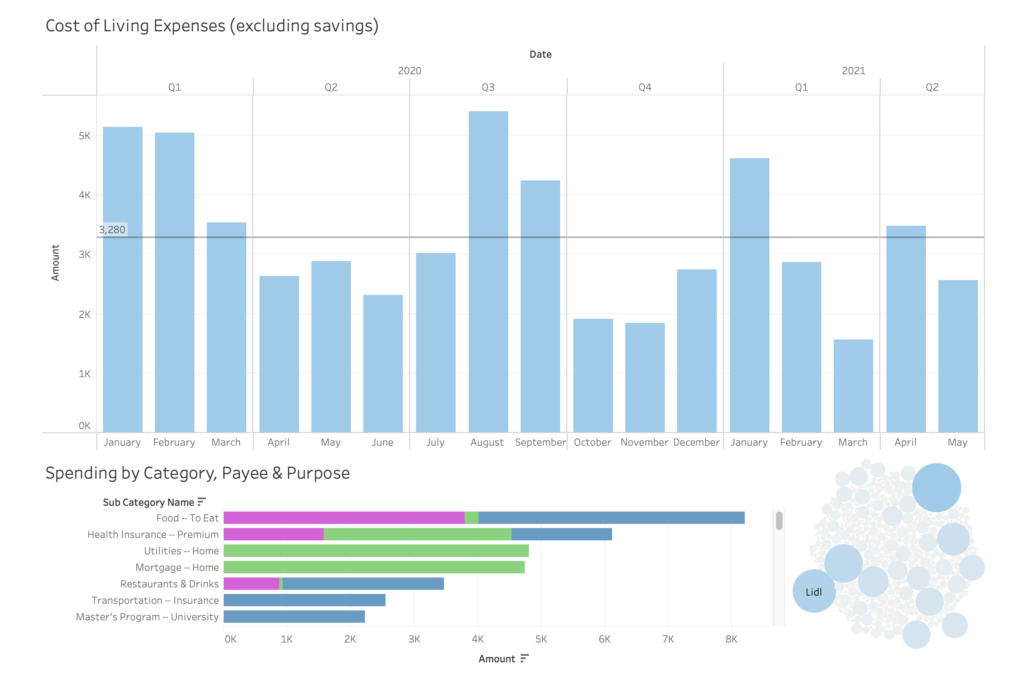
The monthly expenses dashboard shows the trends of our monthly expenses. This becomes very interesting once many months are able to be plotted as a valuable average can be generated. From the spending trend by month, we can see how much on average we spend per month, which gives us directly an indication of how much on average our life costs. This is very useful to point to our baseline.
The second visual to the left, below the monthly trend let us know how much each payee is contributing as well as the top categories per expense type. Prior to 2020, only I was only tracking my finances, but in 2020 after my wife and I got married, we started to track our finances jointly. We also hold a joint account together from which we make joint payments. We find this way of managing our finances is really helpful as she has her own bank account with which she can spend on whatever she wants and has full autonomy over it. I also enjoy the same flexibility with my own bank account, but we also have a joint account from which we can make joint payments such as all the expenses for our current home. In the graph the blue cover is me, the green is our joint account and the purple is my wife’s. To the right of this chart, there is a scatter plot (bubble chart) which shows in detail every expense that has ever been made by either one of us since January 1st, 2020.
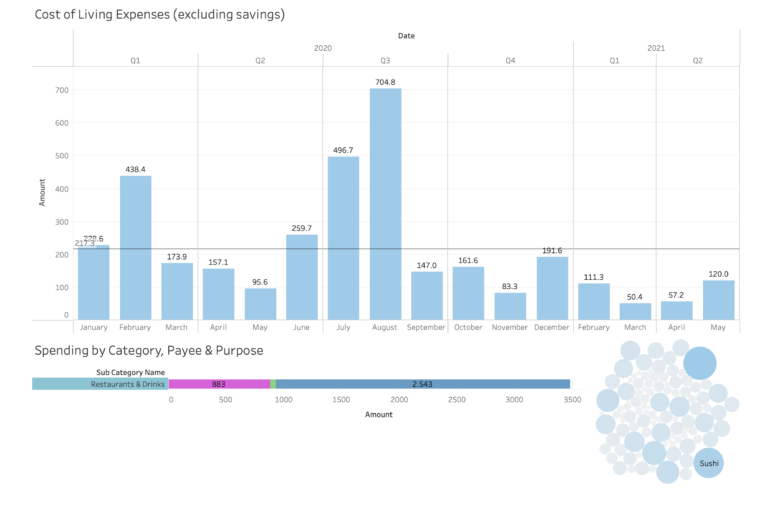
With these three visuals, we are able to see if we have an expensive (above average) month or a cheaper (below average) month. We can then also assess who is paying more per category and what are the most expensive categories, this allows us to adjust spending habits if necessary. Additionally we are also able to see what are the largest individual expenses within the bubble chart., this is useful when drilling down to the detail level. As an example, if we were to analyse the categories of “Restaurants & Drinks”, we could then also see what we spend per restaurant in the scatter plot to the right as well as how much we spent on restaurant per month as well as the average since 2020. By filtering like this, for our situation we see that August 2020 was the most expensive month, on average we spend 217 euros per month on restaurants and that apparently we love Sushi 🙂!

FI Progress

This is probably one of the most important views and definitely one that adds a lot of value in my FI journey. This is also one that anyone pursuing FI should have at their disposal as it summarised the current state of your finances and gives a real depiction of how close you are to achieving FI.
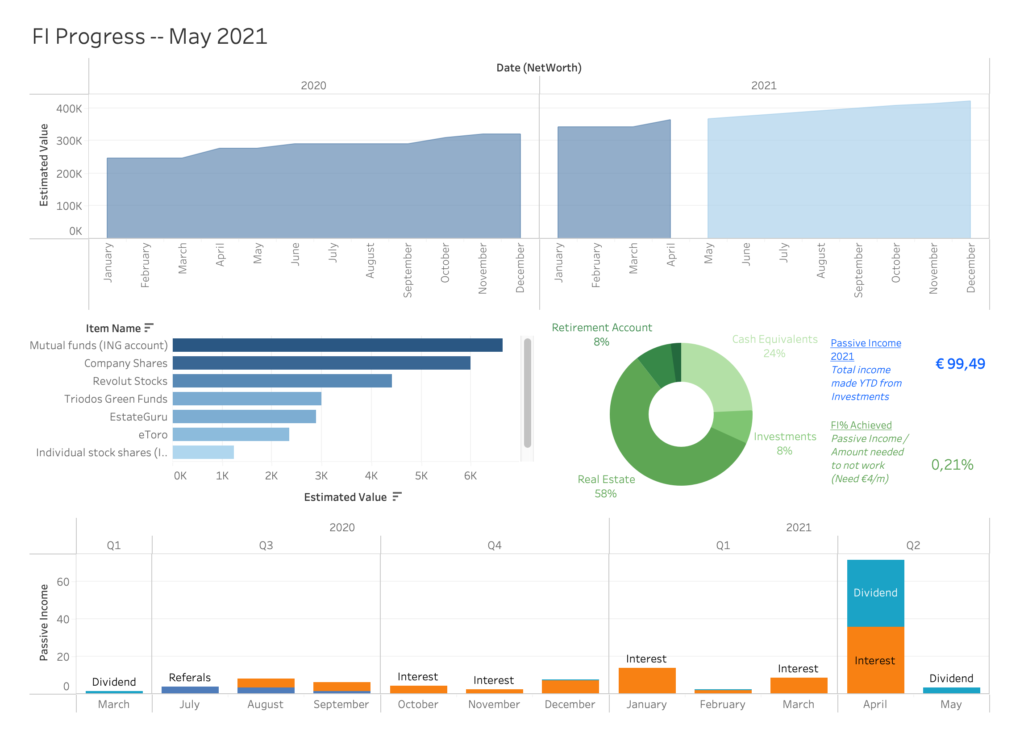
Starting from the top, the first chart shows our Net Worth overtime, starting since January 1st, 2020. There was a time when I was forty thousand dollars in debt and making minimum wage, so for me to see this number where it is today is still kind of unbelievable to me, but a testament that determination and consistency will get you far.
The graph the the left in the middle, shows the different investment accounts or platforms and their respective values. The donut chart in the middle shows our total net worth split by different types of assets. The bottom chart show ‘Passive Income’ per month actually achieved. There are also two calculations within text boxes that are probably the most important take away from this Dashboard – they are “Passive Income 2021” and “FI% Achieved”.
Passive Income 2021 (sum of all passive income received during current year)
This includes total income received during the year until the current date from investments. This is actually funds received into my bank account, not projections or capital gains (where the asset increases in value). This is actually cash that was deposited to my accounts. This could be items such as dividends or interests payments. I call this ‘Passive Income’ to motivate me, but in here I really mean anything that is not coming from my 9-5 job. This calculation sums up all payments made to me within the current year so far.
FI% Achieved (Passive Income Target / Cost of Living per year)
After analysing monthly expenses and conversations with my wife if we were live a life where work would be optional, we concluded that with four thousand euros per month we could cover all of our expenses. This amount could seem excessive to some, maybe way too little for others, the amount is arbitrary. What is important however, is that you have the discussion with your significant other if you have one, and that after analysing your finances you are able to establish what your life would cost if you were to stop making money.
My Advice from 10 years of tracking my finances
The simple exercise of tracking my expenses and net worth helped me tremendously when I had a goal to get out of debt. It gave me clarity. It held me accountable. It also motivated me to do better next month, and enabled me to generate tangible and realistic goals. If you are not yet tracking your expenses and net worth – I would highly recommend you start tracking your expenses today. It does not need to be perfect, complex or difficult. The humble spreadsheet, with a few columns, will get you far!
I have tried many different methods such as Mint.com, several Excel Templates, Dave Ramsay’s Everydollar, several other online platforms, but it all started with a pen & paper. Though I would not recommend doing it by pen & paper, after trying so many different ways to track my expenses I did notice that being actively involved in the detail was the most beneficial. Mint for example downloaded all bank transactions and gave me some visuals, this meant I had to blindly trust the data was complete and of course it missed any transactions made with cash. In contrast, doing it by pen & paper you really felt every transaction but it is very time consuming and I could do nothing in terms of visualisations after compiling the data. For these reason, I would highly recommend Excel (or Google Sheets for a free option) which enables you to write down the transactions to ensure you capture all your expenses (& get to relive them even 😉 for those enjoyable expenses). The added benefit of Google Sheets or Excel is that you can then easily customise visuals that meet your specific needs, exactly like the visuals shown above.
I really hope this gives you some idea on how to start tracking your own expenses and net worth. Let me know in the comments if you have any questions, or share with me how you track your finances – I would be very interested. Wish you happy tracking!

The Value of YOUR PERsonal
Passive Income Target
Your Financial Independence is based on your Passive Income Target. This is the amount that you would need to generate outside of your day job, to live a life where work is optional.
